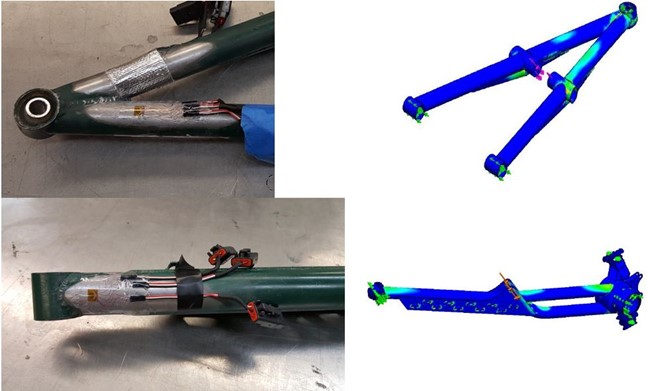
Validation is a necessary step in any engineering design cycle and it is what each Baja team is judged on during design presentations. Strain gages were needed to validate suspension loads from the wheel in various off-road scenarios.
In order to collect strain data from various points of interest on the suspension, I designed signal conditioning circuits to properly amplify the strain gage measurements while allowing for adjustability in amplifier gain setting and wheatstone measurement offset bias. A PCB was developed for the final product of this system, all enclosed in a weather proof case for testing in various off-road scenarios. The sensors would integrate with the DAQ system we already possessed.
Design Considerations:
- Strain Gage Wheatstone Setup
- Readable Voltage Range of DAQ
- Source Voltage
- Expected Ranges of Measurement
- Bias Error in the Wheatstone Bridge
- Temperature effects on Wheatstone Bridge
- Component Cost
Thanks to all the available technical documentation, it was easy to determine critical design considerations and what solutions to use.
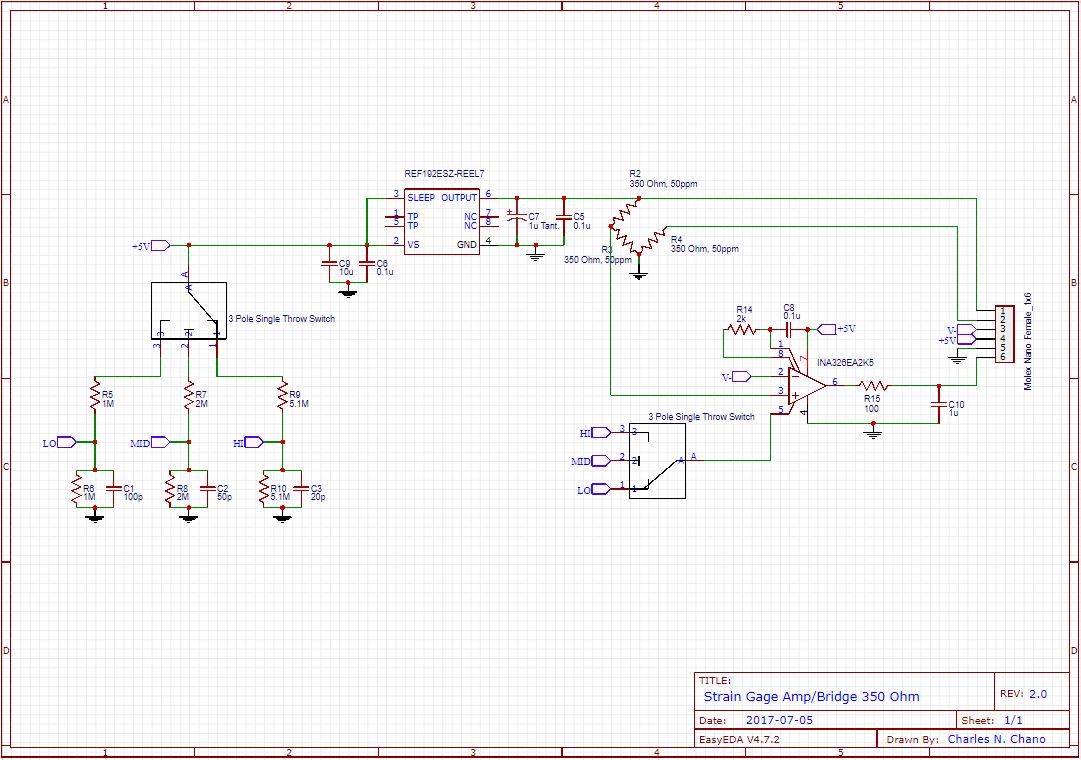
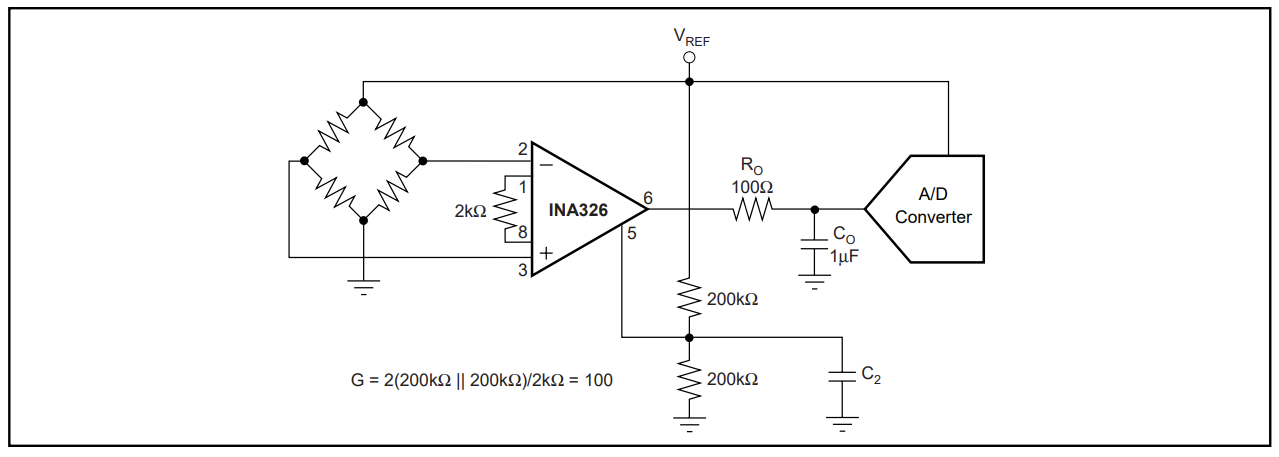
Due to the setup of our measurement locations and limited strain gages, I decided on quarter bridge setups for all the amplifier circuits. To reduce measurement error in the wheatstone bridge, the following was done:
- Procured resistors with low coefficients of temperature deviation and small tolerances.
- Added a seperate wire carrying the measurement voltage from the strain gage to halve the wire resistance.
- Shunt resistors to remove initial measurement bias due to environmental conditions on the strain gage.
- The DAQ's power was passed through a Low Dropout Voltage Reference (REF192) to reduce temperature effects from current and stabilize the reference voltage for the wheatstone bridge.
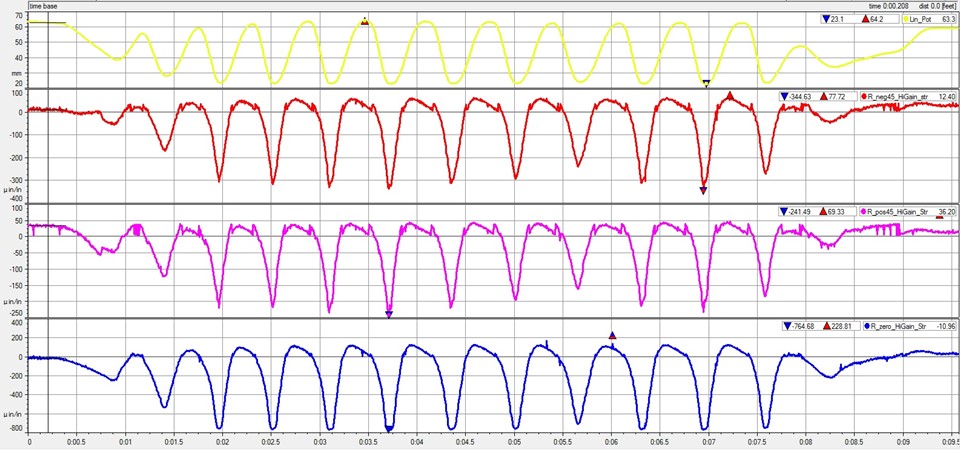
Determining the right amplifier came down to the ranges of strain we could expect to see for the material used on the vehicle and maximizing it to the input rails of the DAQ. The amplifier design had three settable gains that correlated to a ratio of the full elastic range (33%, 50%, 100%) for chromoly (4130) to improve measurement resolution. Since the amplifier did not automatically rescale, it was necessary to check the data to see if changing the amplifier gain was necessary.
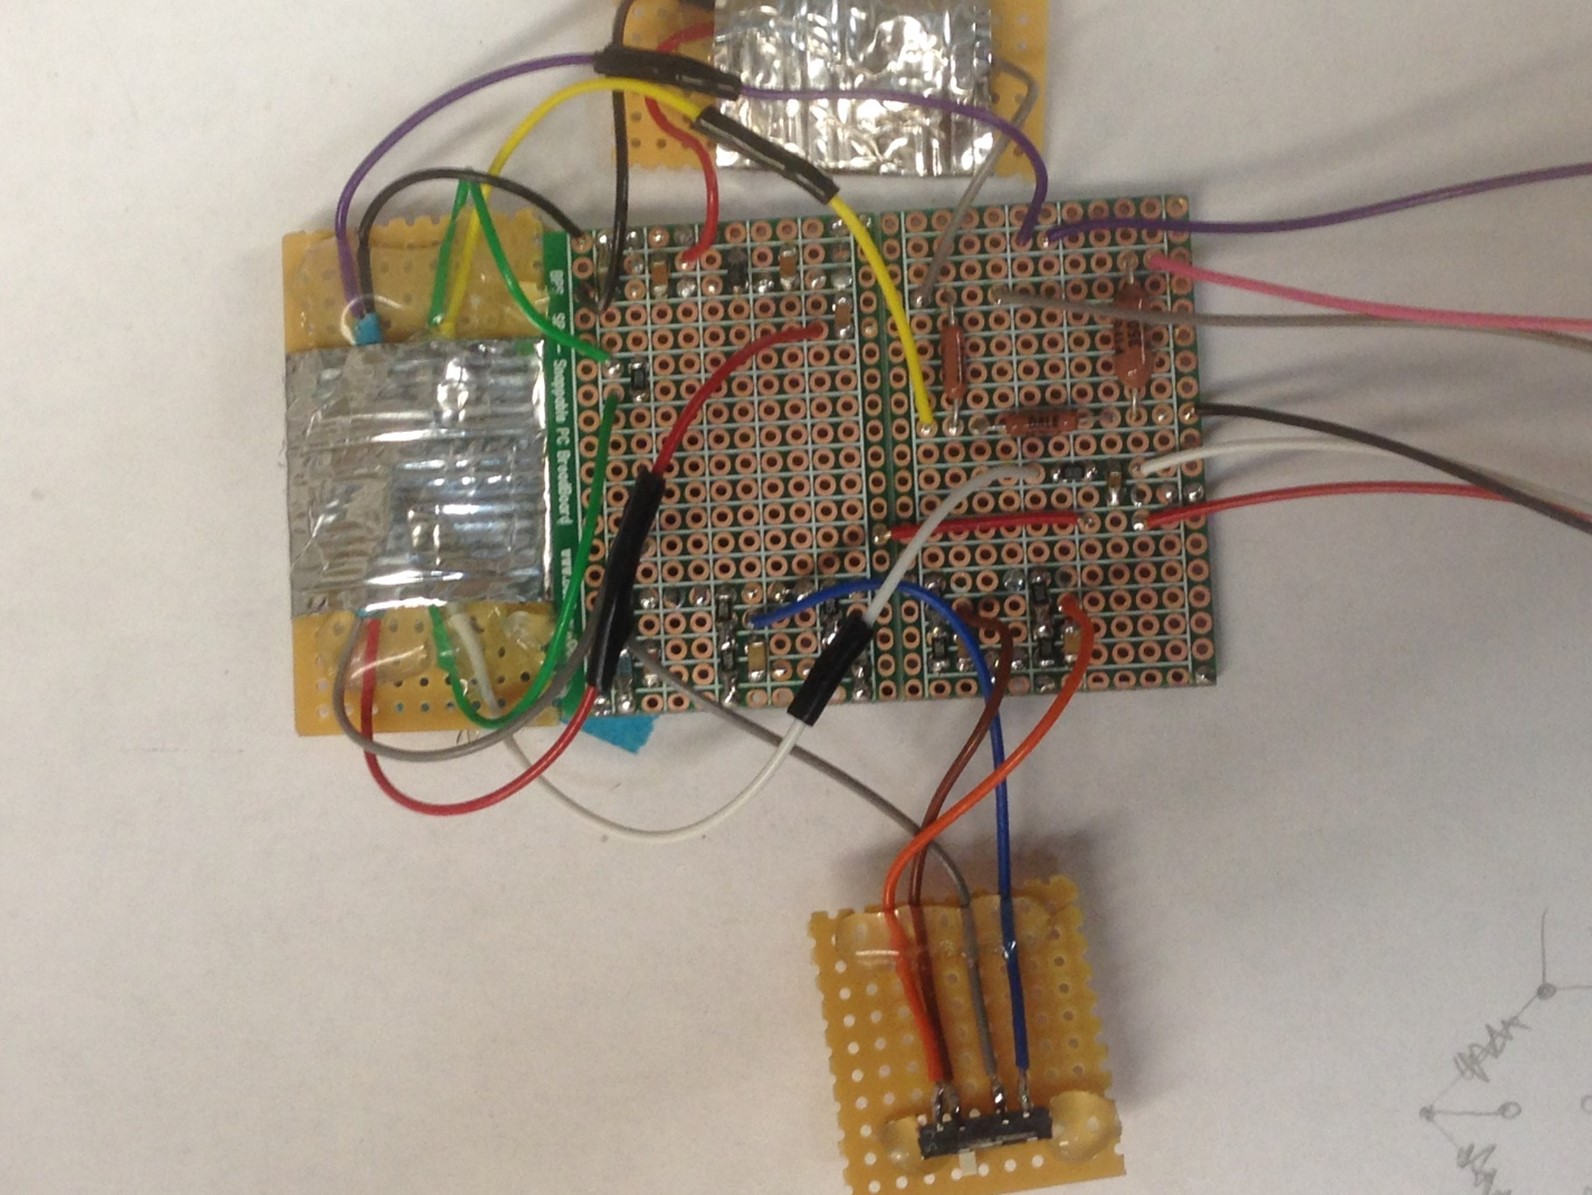
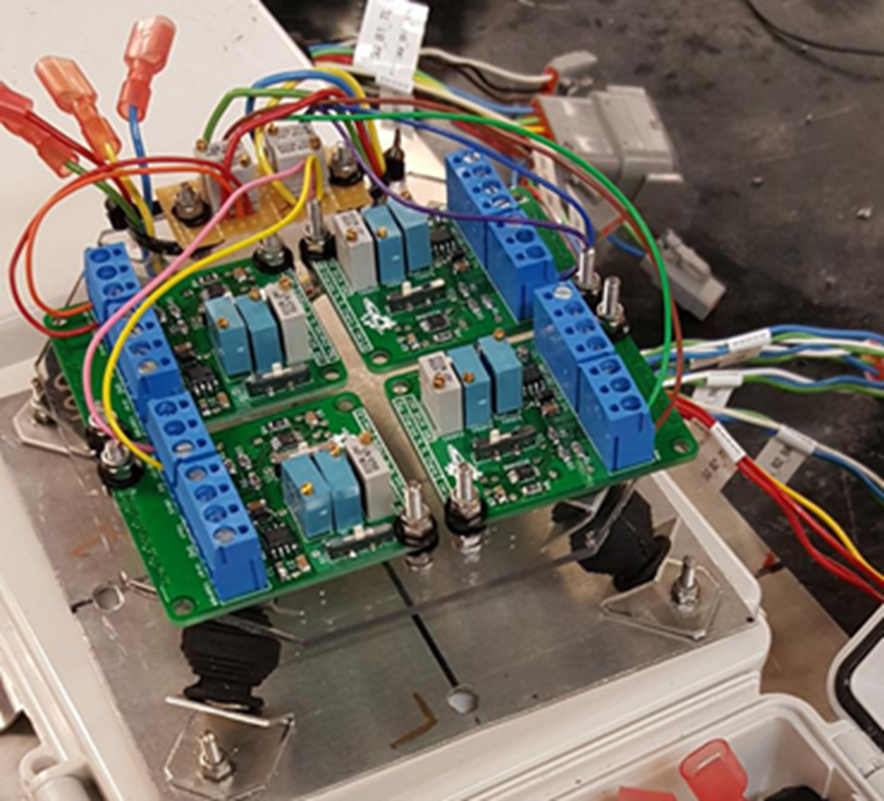
A prototype (Fig. 4) was developed and it was verified manually and on a tensile test machine.
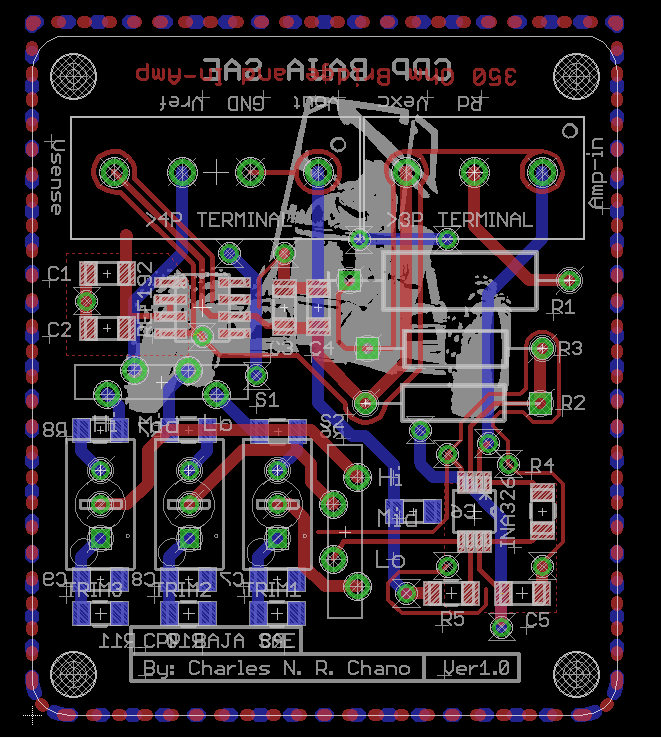
With all the components finalized, it came down to PCB design. The signal conditioning circuit was quite simple but careful consideration was taken to reduce noise based on best practices; such as ground shielding (Fig. 5).
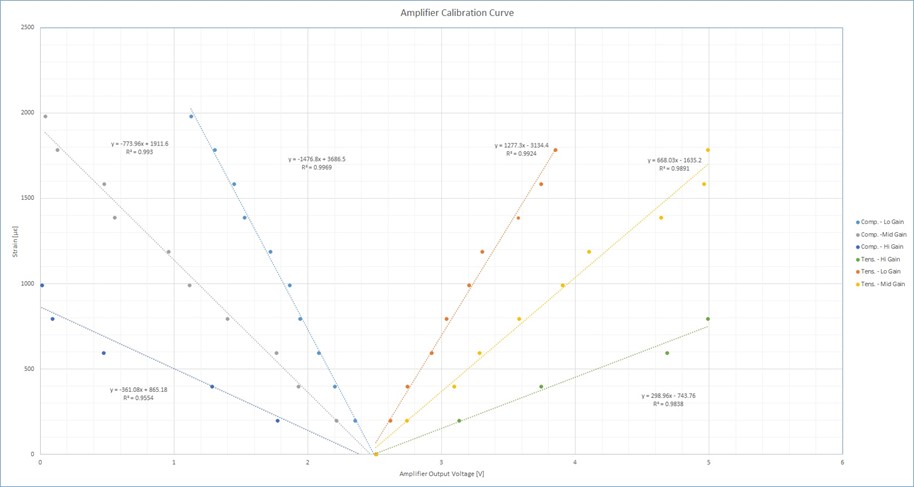
With the completed signal conditioning circuit, a final calibration curve was developed by making use of resistors for completing the wheatstone bridge and shunting the simulated strain gage. Basing the resistance on expected values provided in the strain gage technical documentation.
The strain gages were then able to validate that the experimantal loading conditions of the suspenion. This was huge step in the team's ability to collect invaluable data in order to complete the engineering design cycle.